-
Teaching Support
- - Technology-Enabled Learning
- - WOS Studio
- - MESH
- - Smart Assessment Design Toolkit
- - Placements Hub
- - Digital Learning
- - Academic Integrity
- - Academic Integrity Research
- - Academic integrity quick guide
- Professional Learning @ Western
- Learning Transformations
- The 21C Project
- Contact Us
- Engaged Teaching
Basics of a Graph
Graphs, like equations, are a tool for working with relationships between two (or sometimes more) variables. A basic two-dimensional graph consists of a vertical and a horizontal line that intersects at a point called origin.
The horizontal line is the x axis, the vertical line is the y axis.
In simple line graphs, the x and y axes are each divided into evenly spaced subdivisions that are assigned to numerical values.
To the right of the origin on the x axis, the values are positive numbers; to the left of the origin the values are negative.
On the y axis, values above the origin are positive; below the origin, they are negative.
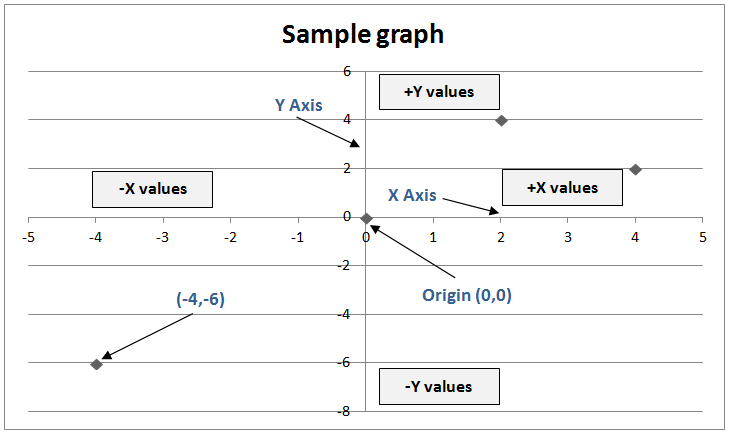
At any given point on the graph, the value of the variable on the x axis, is paired with a corresponding value of the variable on the y axis. The two values are called coordinates because they are coordinated, or associated, with one another.
The first point shown on the graph has an x coordinate of -4 because it is a distance of 4 to the left of the origin and a y coordinate of -6, because it is a distance of 6 below the origin.
This point can be written as x = -4, y = -6, or as (-4,-6).
Mobile options: