- Events, Workshops and Programs
- Resources by Discipline
- Support and Resources by Topic
- FYiMaths NSW
- About the MESH team
- Contact the MESH team
- MESH Research
- Resources for Staff
Line Graphs
Graphing is an important procedure used by scientists to display the data that is collected during a controlled experiment. The most common type of graph used in chemistry is a line graph.
A graph contains five major parts:
A title – this depicts what the graph is about. The title alone should allow readers to understand what the graph is about.
The independent variable – this is the variable that is controlled by the person conducting the experiment. The variable is placed on the x-axis and usually includes measurements such as time, depth, temperature etc.
The dependent variable – this is the variable that is directly affected by the independent variable. It is the result of what happens because of the independent variable. The dependent variable is placed on the y-axis.
The scales for each variable – this is required in order to know where to plot the points representing the data. The scale should start with 0 and increase in intervals, for example, in multiples of 2, 5, 10, 20 etc. The scale of numbers will be dependent on the data values.
The legend – this is a short descriptive narrative about the graph's data.
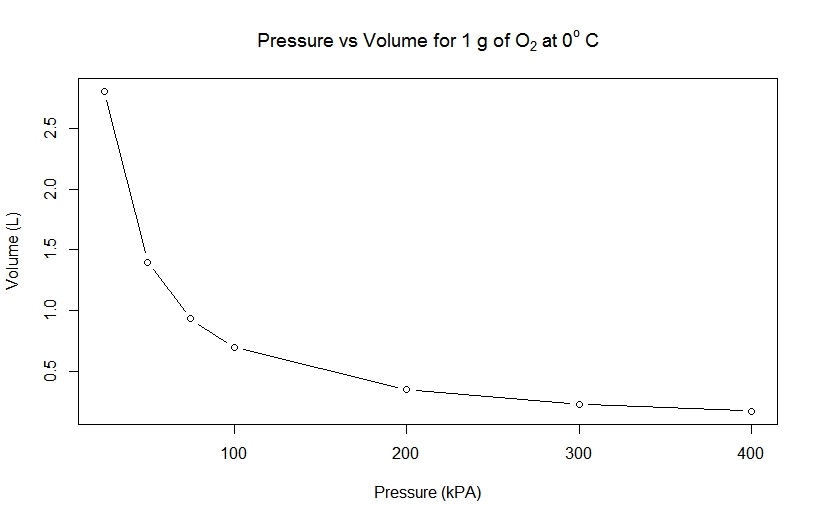
As an example, let's take a look at the following data from an experiment involving measuring the pressure and volume of 1.000 g of O2 at 0o C.
Pressure (kPa) | Volume (L) |
25 | 2.801 |
50 | 1.400 |
75 | 0.9333 |
100 | 0.6998 |
200 | 0.3495 |
300 | 0.2328 |
400 | 0.1744 |
From the data above, we can draw the following graph:
Mobile options: