You can search for courses, events, people, and anything else.
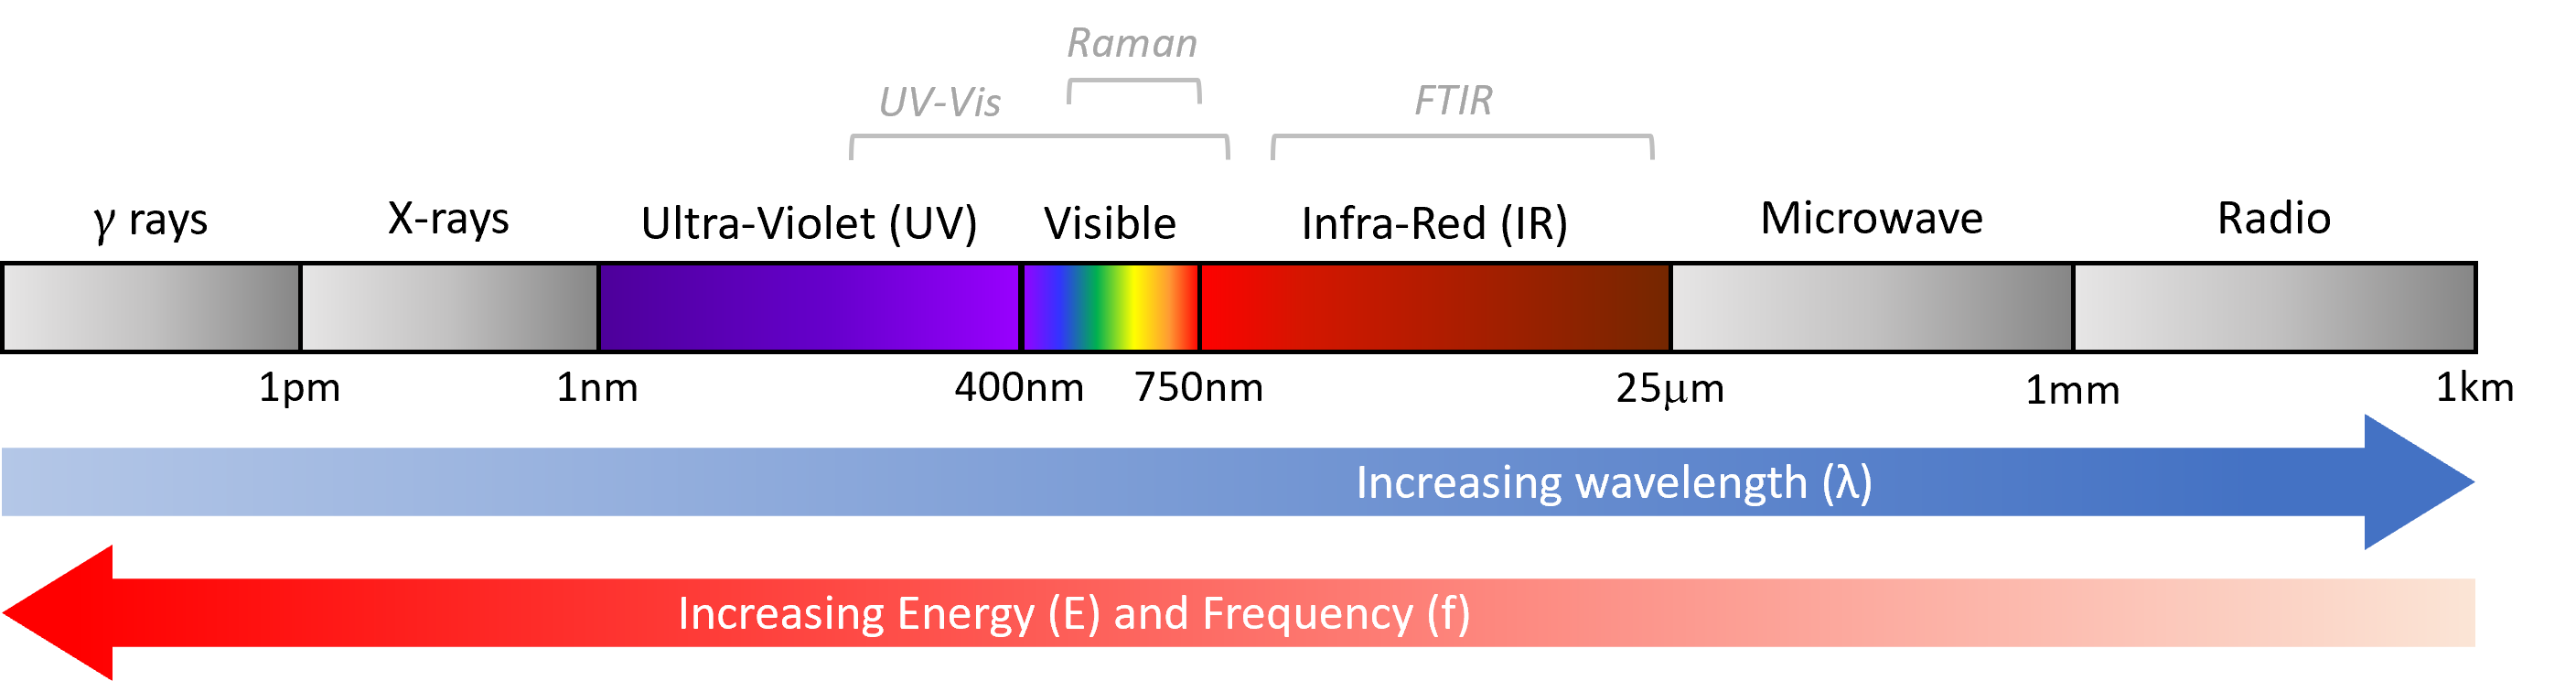
Vibrational (FTIR/Raman) and Electron (UV-Vis) Spectroscopy techniques are non-destructive, and are used for determining the chemical bonds, functional groups and components present in a material. It does this by measuring the interaction of a particular electromagnetic radiation source (as shown below) with a sample (e.g. absorption, scattering). This can therefore be used to identify the type of bonds present in the sample.
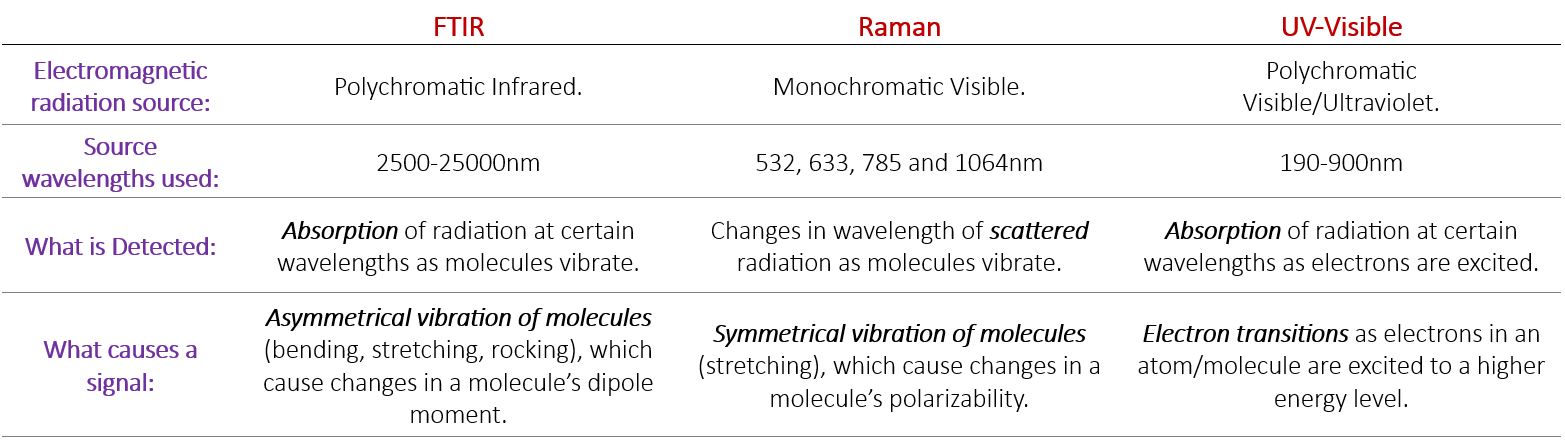
A comparison of vibrationals and electron spectroscopy techniques available at the AMCF.
FTIR
The most common method for collecting an FTIR spectrum from a sample at the AMCF, is through the use of an Attenuated Total Reflection (ATR) stage. An ATR stage uses a crystal with a high refractive index (e.g. diamond or germanium) on which the sample (solid or liquid) is placed. As an infrared beam passes through the crystal, it is reflected internally many times, in turn creating an evanescent wave that extends beyond the crystal and into the sample placed on top.
The sample may then absorb some energy as molecular bonds vibrate and bend. This energy absorption thereby attenuates (i.e. changes) the infrared beam as it returns to the detector. This signal is then used to create an FTIR spectrum, where we can see at what wavelengths/wavenumbers energy was absorbed.
Raman Spectroscopy
Raman Spectroscopy relies on the detection of inelastic scattering of monchromatic light. In other words, we are hitting a sample with a specific wavelength of light using a laser, and detecting changes in wavelength of the light that is scattered after hitting the sample. Most light scattered will have the same wavelength as the incident light (rayleigh scattering), but a small amount of light will have a longer wavelength (stokes raman scattering) as it has lost energy when interacting with molecules, causing them to vibrate.
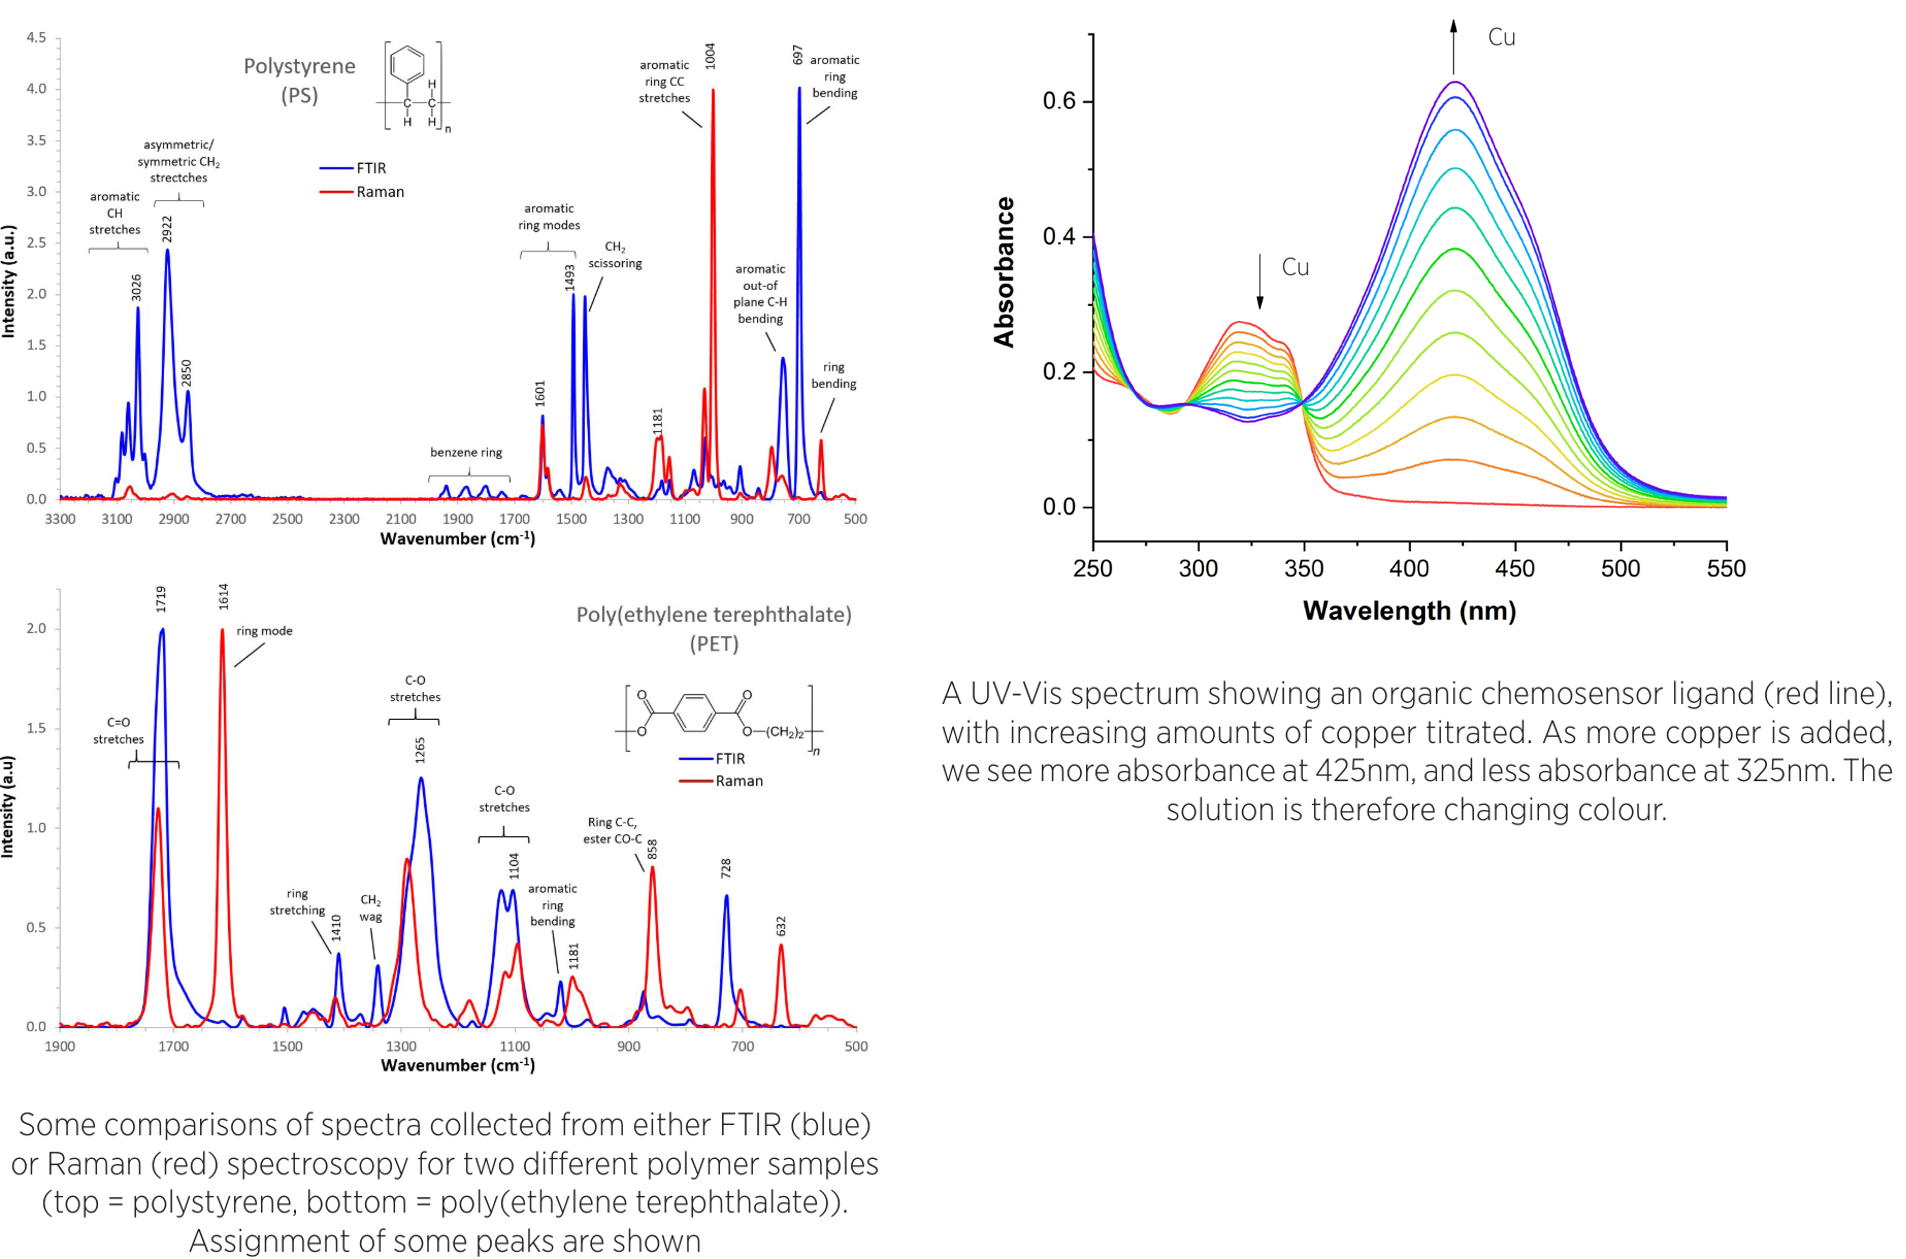
As FTIR and Raman are both analysing molecule vibrations and the energy absorbed, the two techniques are comparable and complimentary. Which technique you should use will depend on the compound you are analysing, and what you’d like to find out. For example, FTIR will give information on bonds with strong dipole moments (asymmetrical vibrations), while Raman will give information on bonds with weak dipole moments (symmetrical vibrations). Some bonds may be seen by both techniques, and some by neither.
UV-Visible Spectroscopy
When electromagnetic radiation in the form of visible and ultraviolet light (UV-Vis) is absorbed by an atom/molecule, this absorbed energy can result in an electron transitioning from a lower to a higher energy level. This may only happen at specific wavelengths, so a spectrum showing at what wavelength energy is absorbed can be created.
As UV-Vis spectroscopy involves electronic transitions, it is particularly of use for analysing conjugated systems and compounds with transition metal complexes. It is also useful for monitring colour changes in samples, or concentrations in solution samples.
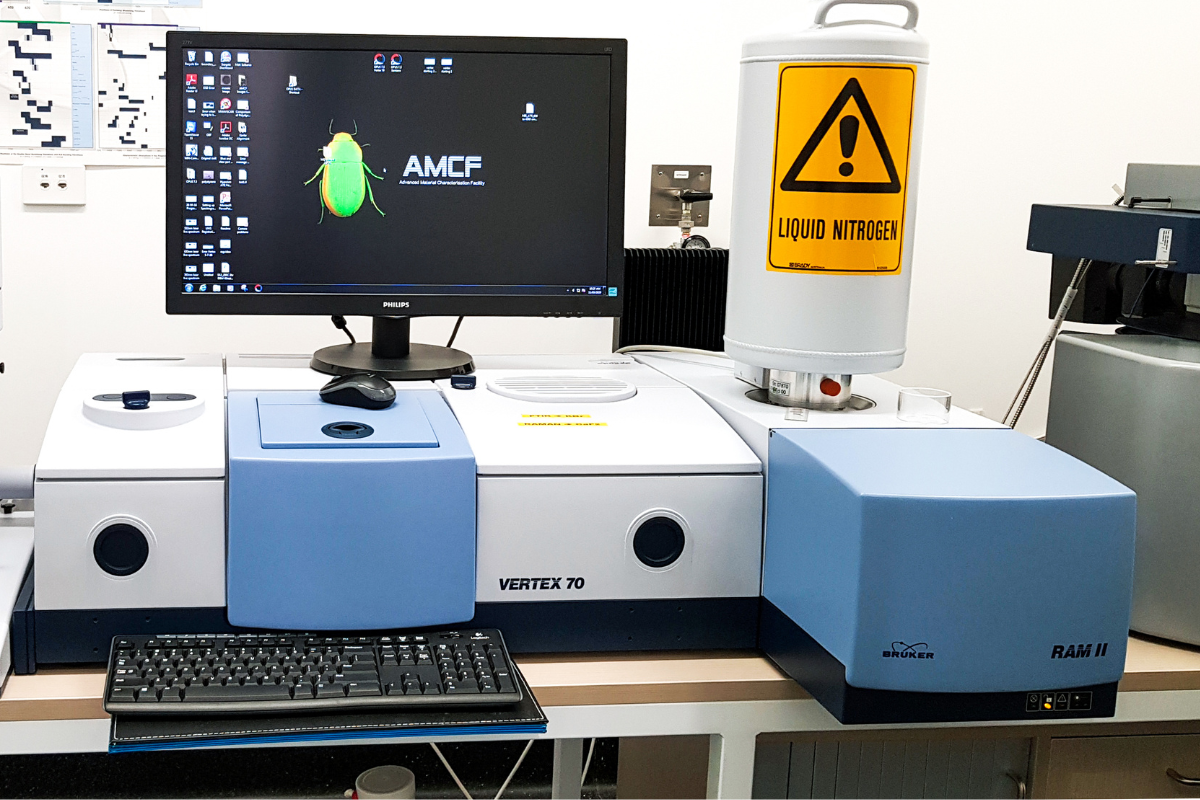
2 x Bruker Vertex 70 FTIR’s
Infrared Source: Mid infrared (MIR).
Spectral Range: Best results for 600-4000cm-1 range, but 400-6000cm-1 is possible.
Detector: Room temperature DigiTect MCT-detector.
Beamsplitters: KBr and CaF (for Raman module) options.
Stages: Diamond ATR, Germanium ATR, Variable temperature stage and a KBr pellet holder for absorption/transmission.
Advantages: The AMCF houses 2 of these FTIRs, as they can be configured for different modes/stages and for the attachment of different modules for more specific experiments. The ATR stages allow for quick and easy analysis of solids and liquids. These instruments are supported by OPUS software package, along with various libraries for spectrum matching.
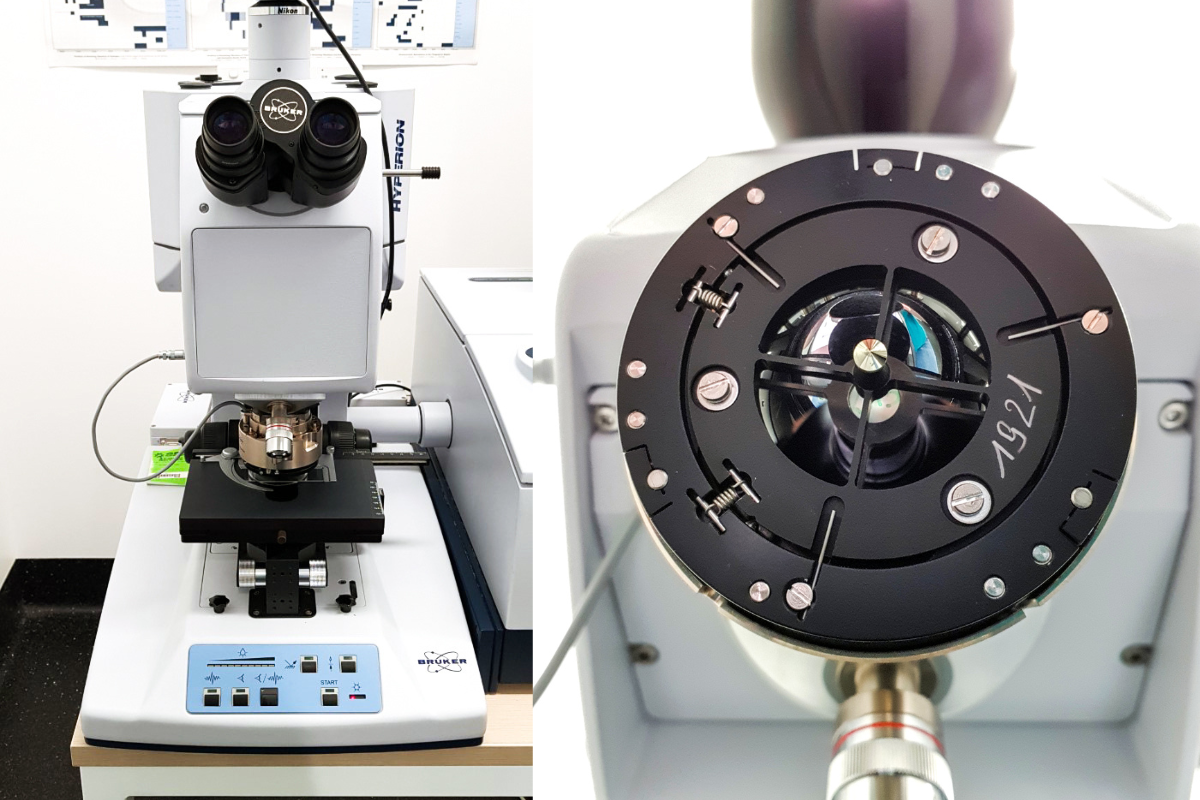
Bruker Hyperion 1000 FTIR Microscope
Infrared Source: Connects and makes use of the Bruker Vertex 70 Mid infrared (MIR) source.
Spectral Range: Best results for 600-4000cm-1 range, but 400-6000cm-1 is possible.
Detector: LN2 cooled DigiTect MCT-detector.
Beamsplitter: KBr
Attachments: a 4x objective lens, 100mm diameter Ge ATR indenter with internal pressure sensor (can also be used as a 20x objective), 15x transmission/reflectance FTIR objective.
Advantages: The optical microscope can be used for locating small areas of interest to be analysed for FTIR. Bright and dark field illumination with binocular and video viewing. Supported by OPUS software package, along with various libraries for spectrum matching.
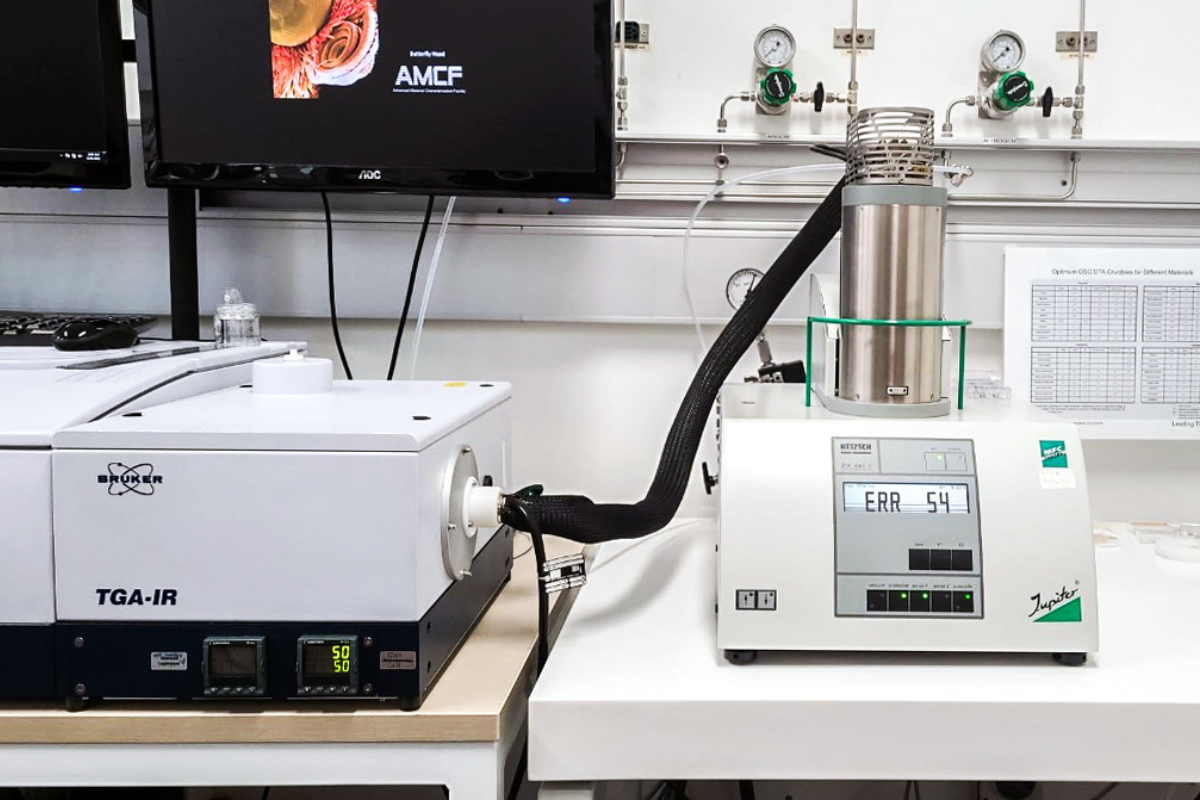
Bruker TGA-IR Evolved Gas FTIR Module
Infrared Source: Connects and makes use of the Bruker Vertex 70 Mid infrared (MIR) source.
Spectral Range: Best results for 600-4000cm-1 range, but 400-4000cm-1 is possible.
Detector: LN2 cooled DigiTect MCT-detector.
Advantages: This module connects via a transfer tube to a Netzsch TGA/DSC thermal analyser. As samples are heated, any evolved gases are sent to the TGA-IR module’s FTIR gas cell for anaysis. This is supported by both Netzsch’s Proteus and Bruker’s OPUS software working in tandem. By combing these techniques it is possible to find at what temperature particular gases have evovled from the sample as it heats or thermally decomposes. Specific FTIR spectra from the 3D spectrum can be extracted for library matching to identify gases.
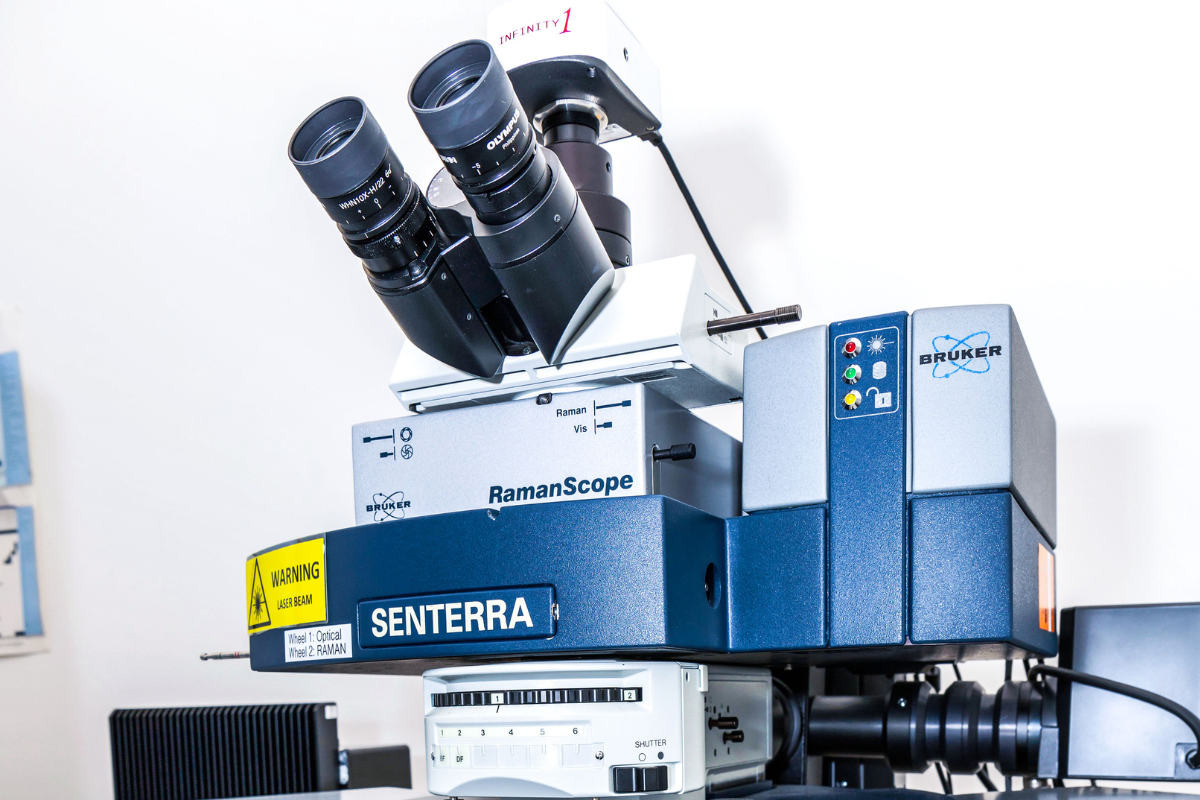
Bruker Senterra Confocal Raman Microscope
Laser Sources: 785nm, 633nm and 532nm. The RAM II 1064nm laser can also be coupled to the spectrometer.
Spectral Range: Best results for 600-4000cm-1 range, but 100-6000cm-1 is possible.
Optical Objectives: x20, x40 and x50
Advantages: This Fourier Transform (FT) dispersive Raman spectrometer, it is quick and easy to use, particulary when needing to change between lasers to find the best parameters for your sample. With both binocular and video viewing, the optical microscope can be used for locating small areas of interest for analysis. It also features an automatic x-y axis stage, allowing the user to load series of points on a sample for automatic analysis using the supporting OPUS software.
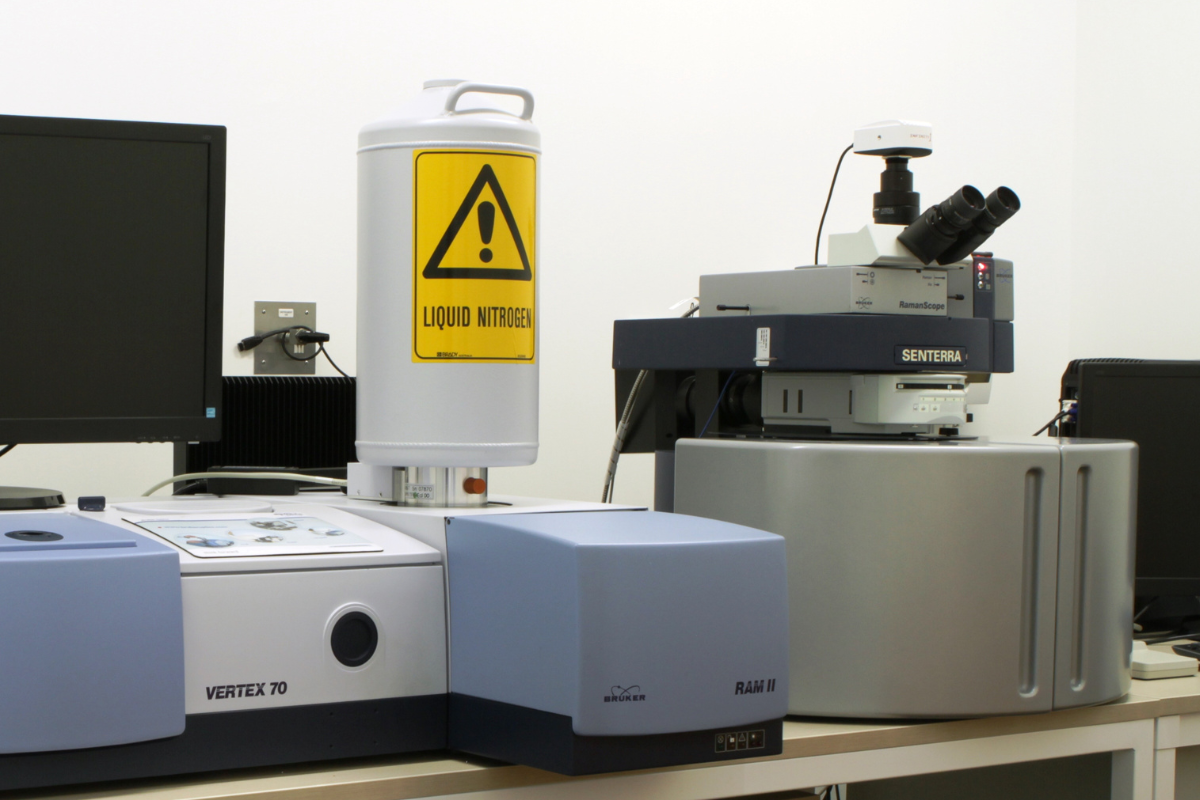
Bruker RAM II Module
Laser Source: 1064nm laser. Connects to the Bruker Vertex 70 for operation. The laser source can also be fed into the Raman Senterra microscope via a fibre optics cable.
Spectral Range: Best results for 600-4000cm-1 range, but 100-6000cm-1 is possible.
Detector: LN2 cooled high sensitivity Ge diode detector.
Beamsplitter: CaF
Advantages: For tricky samples, the 1064nm wavelength laser offers better fluorescence suppression. The RAM II has a large sample compartment. This instrument is supported by an OPUS software package, along with various libraries for spectrum matching.
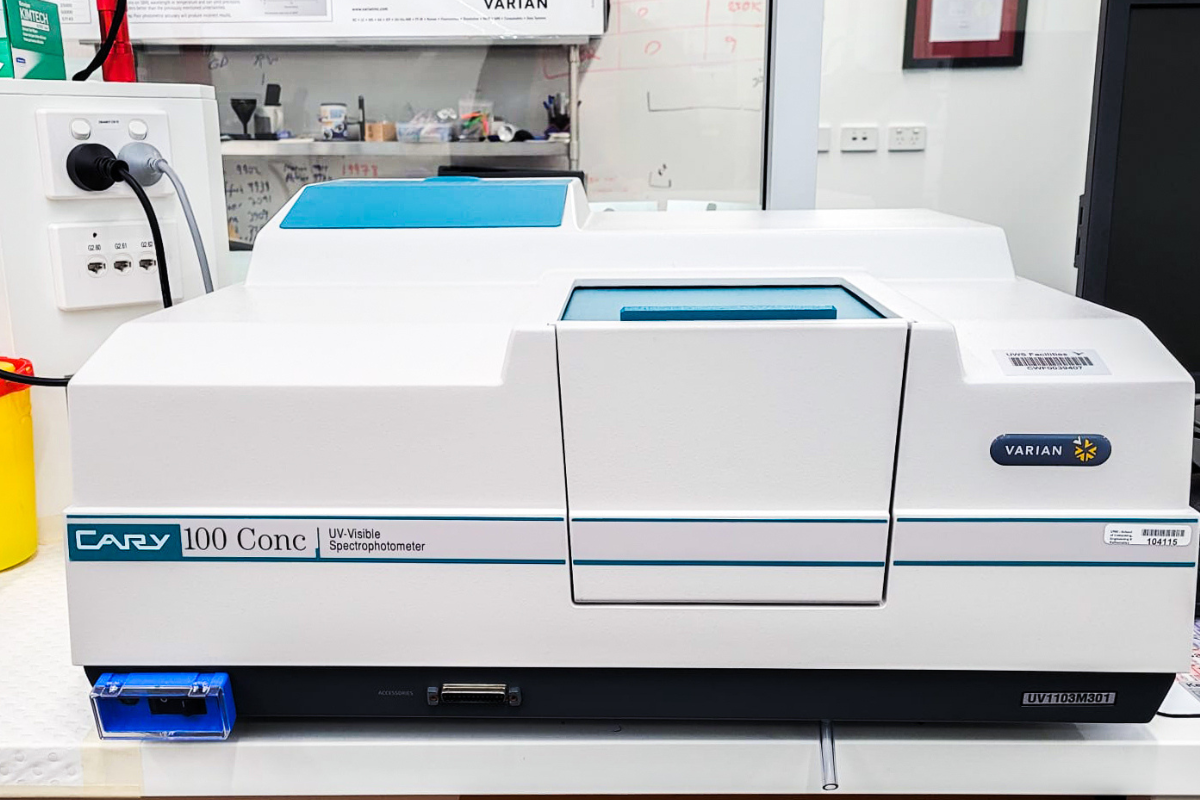
Cary UltraViolet-Visible Spectrometer
Source: Tungsten-halogen bulb visible source with quartz window, deuterium arc ultraviolet source
Spectral Range: 190 - 900nm
Detector: R928 PMT
Accesories: This instrument has several accessories allowing for measurements on a range of sample types, including; a cuvette holder for solutions, a transparent solid sample holder ideal for glass, films, and other transparent solid samples, a Labsphere DRA-CA-30I diffuse reflectance accessory for non-transparent solid samples, such as powders and other materials.
Advantages: Double beam design which can be operated in single, double, or duel-single beam modes.