Sinusoidal Functions
Definition
A sinusoidal function is also called a sinusoidal oscillation or sinusoidal signal and can be written in the form where $M$ denotes the amplitude. $\omega$ is the frequency in radians/sec or degrees/sec and $\phi$ is the phase in radians or degrees.
A sinusoidal function is made of a linear combination of cosine and sine functions: $A\cos (\omega t)+B\sin (\omega t)$. In general, all sinusoidal functions can be written as a “phase-shifted” Sin or Cos function as shown in Fig 1.
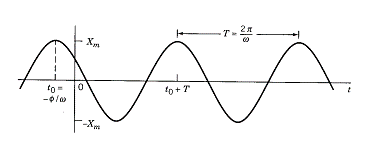
Fig 1: Graph of a sinusoidal function
As seen from the graph above, sinusoidal functions are defined by 3 parameters:
- $X_m=M$: Amplitude
- $T$: Period
- $\phi$: Phase in radians or degrees
Phasor
A phasor diagram is used to show the phase relationships between two or more sine waves having the same frequency. Two sine waves can have a phase difference between themselves where one sine wave may be “leading” or “lagging” another sine wave as shown in Fig 2.
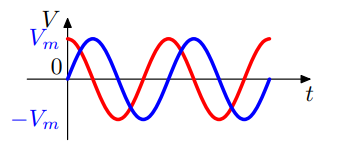
Fig 2: Two sine waves with different phases
In the above figure, wave 2 is leading the other sine wave by $90^\circ$. As the frequencies of both the sine waves are same, the phase difference stays constant.
A phasor is a straight line drawn in such a way that its length is related to the amplitude of the sine wave represented, and its angular position relative to other phasors is related to the phase difference between the quantities.
The phasor diagram of a sinusoidal waveform is given in Fig 3.
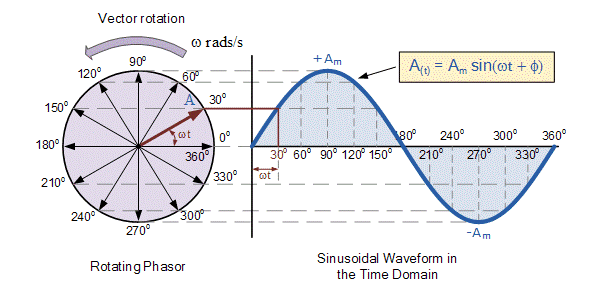
Fig 3: Phasor representation of a sinusoidal waveform
As seen from the figure above, the single vector rotates in an anti-clockwise direction and the tip point $A$ will rotate one complete revolution of $360^\circ$ representing one complete cycle. When the top of the vector is vertical, it represents the positive peak value ($+A_m$) at $90^\circ$ and the negative peak value ($-A_m$) at $270^\circ$.
The phasor diagram of two waveforms in Fig 2 can then be drawn as shown in Fig 4.
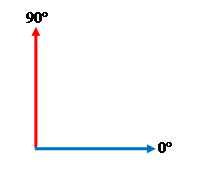
Fig 4: Phasor diagram
Additional Resources
- Sinusoidal function from a graph - Khan Academy video on the sinusoidal function
- Periodic Functions - detailed notes with examples and exercises on sinusoidal functions
- Sinusoids - an online tutorial on sinusoids with detailed examples and MATLAB codes
- Phasor diagrams and phasor algebra - online tutorial on phasors
- Phasors - further detailed notes on phasors.
Mobile options: