-
Teaching Support
- - Technology-Enabled Learning
- - WOS Studio
- - MESH
- - Smart Assessment Design Toolkit
- - Placements Hub
- - Digital Learning
- - Academic Integrity
- - Academic Integrity Research
- - Academic integrity quick guide
- Professional Learning @ Western
- Learning Transformations
- The 21C Project
- Contact Us
- Engaged Teaching
Line Graphs
Graphing is an important procedure used by scientists to display the data that is collected during a controlled experiment. The most common type of graph used in biology is a line graph.
A graph contains five major parts:
A title – this depicts what the graph is about. The title alone should allow readers to understand what the graph is about.
The independent variable – this is the variable that is controlled by the person conducting the experiment. The variable is placed on the x-axis and usually includes measurements such as time, depth, temperature etc.
The dependent variable – this is the variable that is directly affected by the independent variable. It is the result of what happens because of the independent variable. The dependent variable is placed on the y-axis.
The scales for each variable – this is required in order to know where to plot the points representing the data. The scale should start with 0 and increase in intervals, for example, in multiples of 2, 5, 10, 20 etc. The scale of numbers will be dependent on the data values.
The legend – this is a short descriptive narrative about the graph's data.
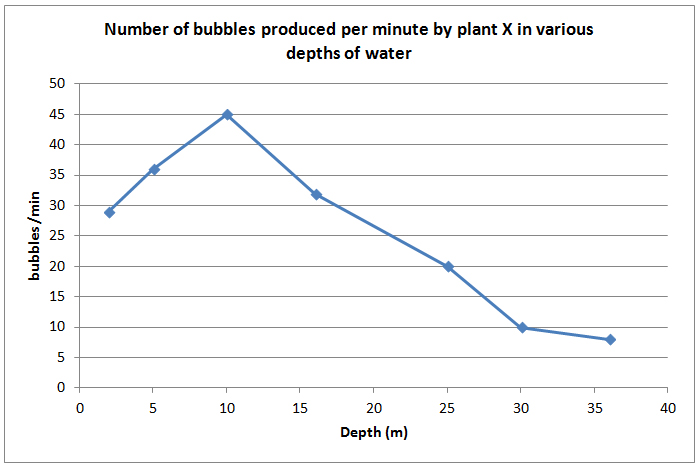
As an example, let's take a look at the following data from an experiment involving placing plant X in various depths of water to measure how many bubbles were created.
| Depth (m) | Number of bubbles |
| 2 | 29 |
| 5 | 36 |
| 10 | 45 |
| 16 | 32 |
| 25 | 20 |
| 30 | 10 |
| 36 | 8 |
From the data above, the following graph can be constructed using a program such as Microsoft Excel:
Mobile options: