Text Dependent SID
Noise-robust Text-dependent Speaker Identification using Cochlear Models
Md Atiqul Islam, Ying Xu, Travis Monk, Saeed Afshar, André van Schaik
The Journal of the Acoustical Society of America 151, 500 (2022); https://doi.org/10.1121/10.0009314
-------
The International Centre for Neuromorphic Systems (ICNS)
The MARCS Institute for Brain, Behaviour and Development
Western Sydney University
Penrith, Australia 2751
Email: Atiq.Islam@westernsydney.edu.au
What is it?
-----------
This page contains the datasets used in the paper above.
Formats
-------
The dataset is provided as .mat files
Dataset Summary
---------------
There are two datasets of speakers repeating fixed utterances, recorded in .wav format. The .txt files give more details about the datasets.
How to cite
-----------
Please cite the following paper when using or referencing the dataset:
TBD
The effect of pole-zero distance and damping factor on the performance of the CARFAC
FIG. SuppPub1 shows the dependence of the BM response on the value of h. When h=c0 =sin (2πfc/fs), there is a half-octave distance between the pole and zero. Here, fc is the characteristic frequency of each section of the cascade and fs is the sampling frequency. In our simulations, we set the values of fs to 16 kHz and fc is determined by the Greenwood function (Greenwood, 1961) to map 25 channels from 125Hz to 3kHz. We set the upper-frequency limit at 3kHz because most SID cues, such as the speaker’s fundamental frequency, pitch, and formants (f1 and f2), are below this frequency (Stemple, Roy, & Klaben, 2018).
FIG. SuppPub1A shows that, as h reduces, the peak response of the BM filter becomes increasingly asymmetric. This asymmetry reduces overlap among filter responses at their high-frequency slopes. Thus, a lower value of h produces less correlated output from the BM, which improves SID performance. We chose h =0.35*c0, i.e., the pole-zero distance is less than a semi-octave. FIG. SuppPub1B shows the effect of the damping factor on SID accuracy for the CARFAC method for four SNR values. The damping factor controls the BM response compression. In human hearing research, typical values of the damping factor range from 0.1 to 0.4 (Lyon, 2017). We set the damping factor to 0.15, which achieves the best SID accuracy as shown in FIG. 1BS.
A) |
B) |
|---|
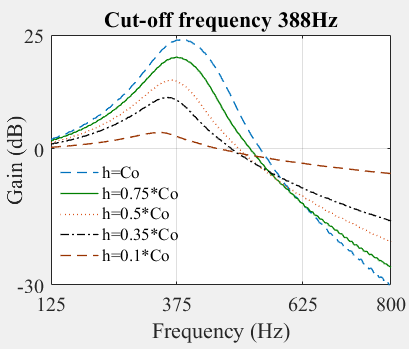
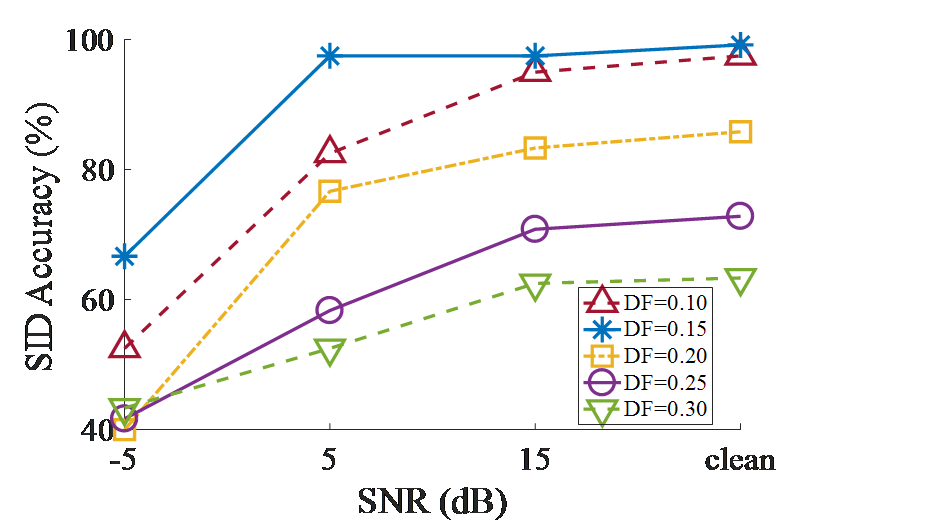
FIG. 1S: The effect of pole-zero distance on the CARFAC basilar membrane frequency response (A) the dependence of CARFAC’s SID performance on the damping factor (B).
Performance on other types of non-stationary noise.
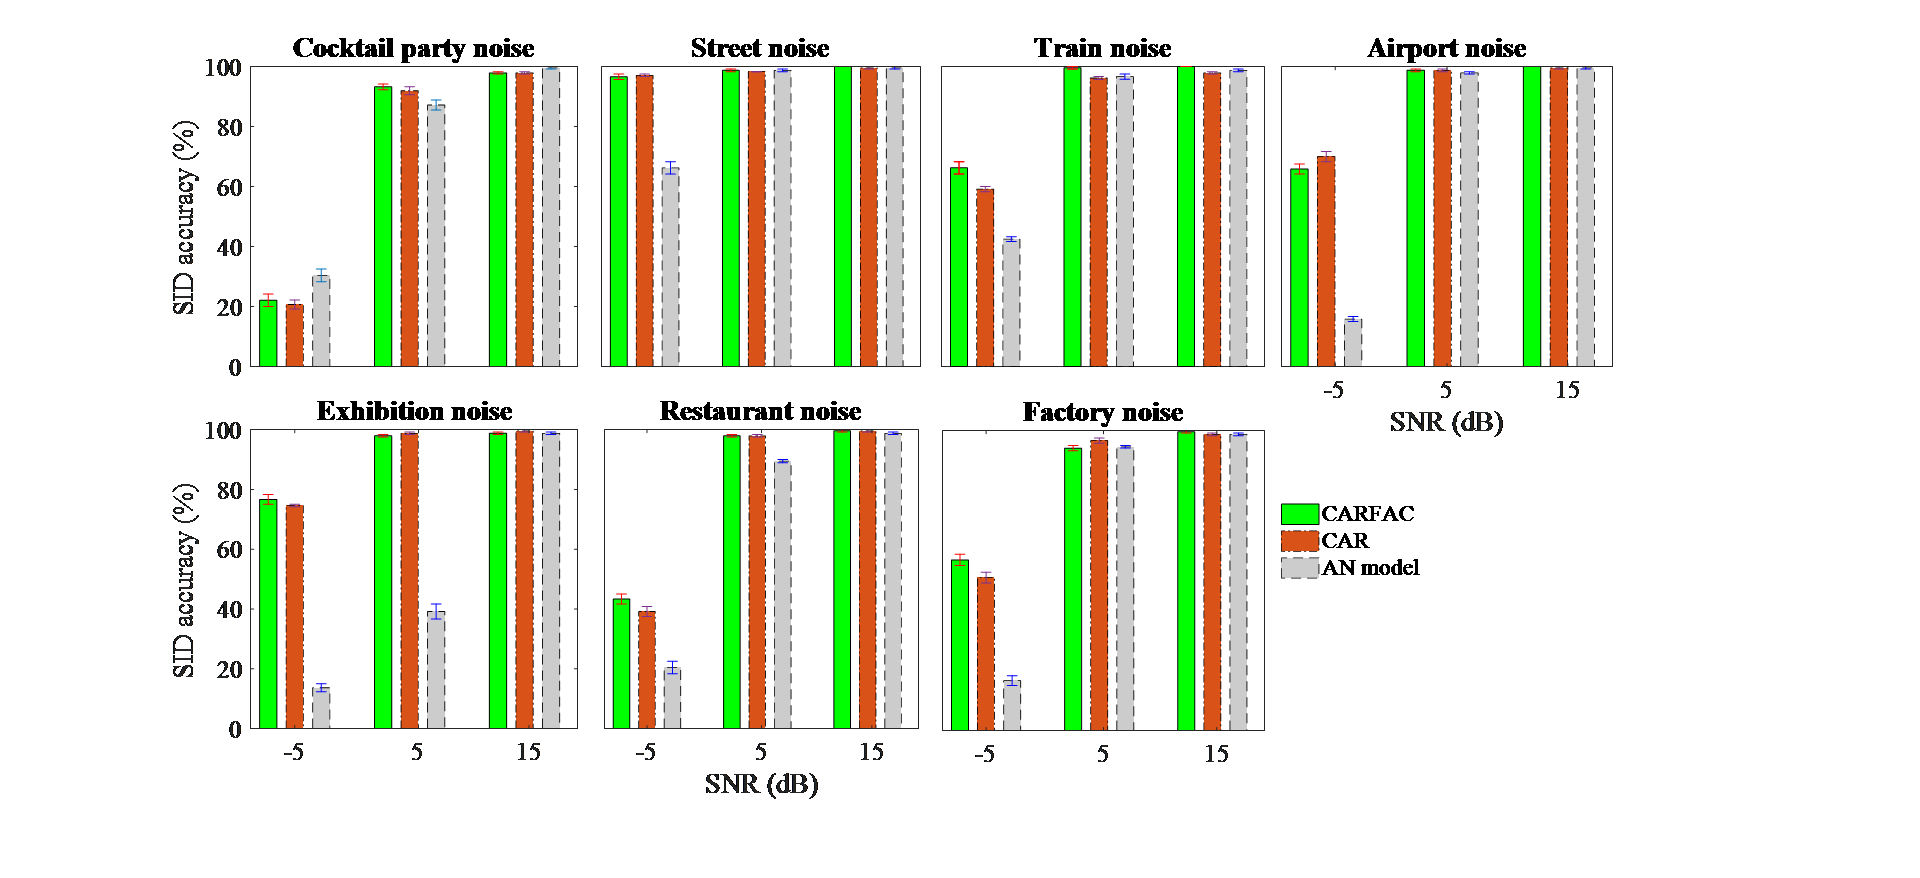
FIGS. 6 and 7(in the main file) showed that all SID algorithms struggle to classify speakers given non-stationary noise corrupted data (street noise at -5dB). FIGS. 15 and 16 show that the cochlear front-ends can classify speakers more accurately when we apply the cubic root and DCT to their output. Here, we investigate how accurately cochlear front-ends classify speech given other types of nonstationary noise when they are aided by these additional nonlinear computations. We applied the cubic root and DCT to the CARFAC, AN model, and CAR output features to compare their performance under non-stationary noise. We added car, babble, restaurant, train, train station, and exhibition noise to the UM dataset at -5dB and 0dB SNR.
FIG. 15 (in main file) again shows that applying the cubic root exponent and DCT to cochlear front-ends can improve SID accuracy under non-stationary noise. The CAR front-end sometimes outperforms the CARFAC front-end at -5 dB (left panels), which is consistent with FIG. 16 (main file, middle panel, pink noise). Presumably, the fast-acting compression in CARFAC changes the temporal and spectral contrasts of input signals and causes background noise to be more audible during the non-speech period (Kuk & Hau, 2017). The AN algorithm also outperforms the CARFAC algorithm at -5 dB SNR (gray and green bars, all panels), which is consistent with the right panel in FIG 16 (main file). All front-ends classify nonstationary data rather poorly at -5 dB SNR compared to pink and white noise which is consistent with previous figures (main file, FIG 6, 7, 15, 16). Noisy nonstationary data is difficult to classify because its noise has a high and complex energy distribution that strongly distorts clean features. This investigation suggests that there is no universal nonlinearity that classifies noisy nonstationary speech well. Different nonlinearities favor different noise types.
Comparing all results in FIG. SuppPub2, we see that the CARFAC provides significantly improve performance at 5 dB compared to -5 dB SNR which is consistent with FIG. 15 and 16 (in main file). Below that threshold, the performance of the CARFAC reduces significantly, but, still mostly outperforms the CAR and the AN algorithm. Thus, the FAC and instantaneous nonlinearity sections of CARFAC are important for boosting performance when the SNR is low as shown in FIG. 2S.
 |
|---|
FIG. 2S: The SID result showing the effect of cubic root and DCT on the CARFAC, AN model, and CAR methods for the Bangla dataset. Results are shown using the SVM back-end.
However, other nonlinear computations can potentially boost SID performance given noise-corrupted inputs (c.f. FIG. 2S, FIG. 6, and 7 street noise columns). But different types of nonlinearities affect SID performance differently, depending not only on the types of nonstationary noise but also on the background noise levels.


