Historical data
Historical water quality data
The water quality monitoring of the river system first began over 50 years ago. Today, it is monitored mainly by Sydney Catchment Authority, Sydney Water and local councils. Over the last decade, a number of community groups also engaged in water quality monitoring, through Streamwatch (opens in a new window) and Waterwatch (opens in a new window) programs.
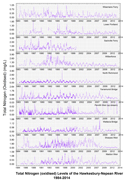
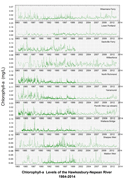
Here we present historic trends of (1984 to 2014) weekly data for Total Phosphorus, Total Nitrogen (Oxidised) and Chlorophyll-a, using data obtained from the Sydney Catchment Authority. The trends of historic data play a key role in understanding various types of human impacts on the river system. These include effluent discharge, floods, drought periods, etc.
For in depth analysis and trends for other variables, interested readers are encouraged to access the following key documents:
- Hawkesbury-Nepean River Environmental Monitoring Program (opens in a new window)
- Analysis of long-term water quality for effective river health monitoring in peri-urban landscapes—A case study of the Hawkesbury–Nepean river system in NSW, Australia (opens in a new window)
Most data records begin in 1984/83 period. When reading the graphs, please pay attention to the scale on left hand side as this may be slightly different for different sites. In the graphs below, all values recorded originally in the database as <0.01 mg/L, <0.02 mg/L and <0.005 mg/L appear as 0.01 mg/L, 0.02 mg/L and 0.005 mg/L.
Total Phosphorus
 Phosphorus is a plant nutrient usually present in rivers as orthophosphates (i.e., sewage), metaphosphates or polyphosphates (i.e., detergents) or organically bound phosphates. It is an essential element for the growth of plankton and aquatic plants in the bottom of food chain which will be a food source for larger animals. The main source of phosphorus includes sewage, industrial waste and fertilizer.
Most sewage treatment facilities on the river system are capable of effectively removing phosphorus from sewage, however when large amounts of fertilizers are applied to agricultural areas, phosphorus can be easily entered into the river system during heavy rainfall events. Total phosphorus is a good indication of river health because elevate levels of this nutrient often promotes 'eutrophication' (algae blooms). Phosphorus is usually the limiting nutrient in freshwater systems.
The current ANZECC and ARMCANZ 2000 (opens in a new window) guideline for total phosphorus is <0.02 mg/L (for upland rivers) and <0.05 mg/L (for lowland rivers) to maintain ecosystem health.
Total Nitrogen (Oxidized)
 Similar to phosphorus, nitrogen is another important plant nutrient in water. Its sources are mainly commercial fertilizers, livestock manure, legumes, human domestic waste and municipal effluent. The three basic forms of nitrogen in water are ammonia, nitrates and nitrites.
Usually, when the amount of nitrogen is reported as total nitrogen, it is the sum of ammonia, organic nitrogen, reduced nitrogen, nitrates and nitrites. However, here we present historic trends of total oxidised nitrogen which is only the sum of nitrate and nitrite. The current ANZECC and ARMCANZ 2000 (opens in a new window) guideline for total nitrogen is <0.25 mg/L (for upland rivers) and <0.5 mg/L (for lowland rivers) to maintain ecosystem health.
Chlorophyll
 Chlorophyll is a green pigment present in all photosynthetic organisms. Among different types of other pigments in aquatic plants, we measure chlorophyll-a as an indication of phytoplankton abundance (algal blooms) in coastal and estuarine waters. The level of chlorophyll-a is often affected by rainfall, temperature, tide and flow regimes. Thus, it is important to pay attention to long term persistence of high levels to a given site rather than seasonal peaks or troughs.
The current ANZECC and ARMCANZ 2000 (opens in a new window) guideline for chlorophyll-a is <0.005 mg/L (for upland rivers lowland rivers) to maintain ecosystem health.
Mobile options:

