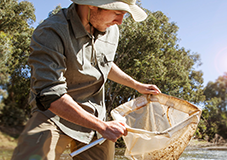
Community collected data
There are number of community and school based water quality monitoring initiatives in the Hawkesbury-Nepean catchment. By involving water quality monitoring programs, communities can experience problems and issues related to water quality first hand and raise the voice on future management issues of the river system. This information is a valuable asset to obtain a snapshot of the water quality in a particular region.
SEED Database (Streamwatch)
Streamwatch is an educational and capacity-building program that utilises the passion of community groups (citizen scientisits) to monitor the quality and health of local watercourses across the greater Sydney and Blue Mountains and Illawarra regions. On the SEED database (opens in a new window) you can find community dataset includes physical and chemical parameters collected during the period from 1990 to 2020. Environmental monitoring data was collected monthly by trained volunteers during this period.
The Streamwatch (opens in a new window) program was originally funded and managed by Sydney Water, transferred to the Australian Museum in 2012 and then to Greater Sydney Landcare Network (GSLN) in 2019. Streamwatch water quality data methodologies align with the national Waterwatch program and GSLN understands the importance of making this data publicly available for future use.
Want to get involved in collecting community data? Join a local Streamwatch (opens in a new window) group near you.
School's River Ecology Program (Brewangle Environmental Education Centre)
This secondary education program has been running since 2009. Students collected water quality data for 6 parameters, namely temperature, alkalinity and acidity, dissolved oxygen (as saturation percentage and concentration), electrical conductivity and turbidity. The sample locations varied considerably over the years and exact location may be anywhere 400 metres downstream of Sackville Ferry. Please note that this data has been collected by high school students (most were doing this for the first time) for educational purposes. To see a brief snapshot of their data and what is means read the Pulse of the River report (opens in a new window) that was generated in June 2014. The program still runs today.
Mobile options:


